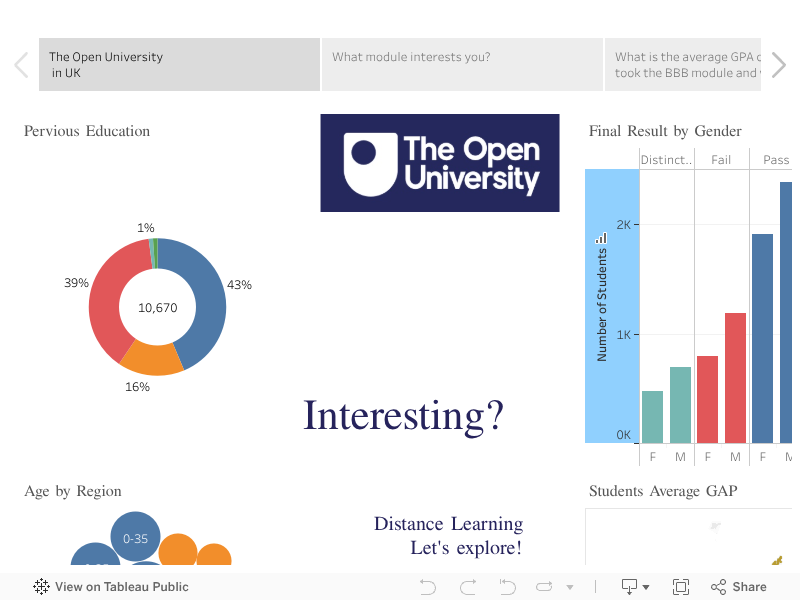
📊 This project analyzes student demographics and performance metrics from The Open University in the UK, focusing on the October 2014 cohort of 10,670 learners. Using Tableau, I explored patterns across gender, age group, region, and prior education to uncover insights that could inform support strategies and curriculum planning.
- Previous Education Impact: How qualification levels affect dropout rates.
- Final Results by Gender: Performance differences between male and female students.
- Age & Region Analysis: Understanding how student demographics vary across the UK.
- Students’ Average GPA: Mapping academic performance across different locations.
🛠 Tools Used
- Data Processing: Excel, SQL
- Geospatial Mapping: GeoJSON, Mapshaper
- Visualization: Tableau
- Analytics Focus: Student Retention, Performance Metrics, GIS Mapping
📍 Geospatial Analysis
For mapping regional academic trends, I processed geospatial data using:
- GeoJSON: Customizing spatial data for student distribution mapping.
- Mapshaper: Simplifying and refining geographic boundaries for visualization in Tableau.
📊 Interactive Dashboard